


Financial KPIs such as RevPAR and GOPPAR indicate whether a hotel is profitable; however, they do not reveal whether guests can locate the property online.
Leppur Marketing examines the hospitality SEO metrics that are most relevant, from direct booking rates to local search visibility, so that owners and marketing directors understand which indicators to monitor.
Key Takeaways:
- Track direct booking revenue and organic traffic growth to measure SEO impact on commission-free reservations, not just occupancy rate or rooms sold.
- Monitor Customer Acquisition Cost (CAC) from organic search versus paid channels to prove SEO’s ROI for hotel owners, and compare it to cost per occupied room (CPOR) and labor cost to evaluate operational efficiency.
- Measure local pack rankings, Google Business Profile engagement, and AI discovery visibility to capture high-intent travelers, while also tracking click-through rate and open rate from email campaigns to measure email-attributed revenue and revenue per email recipient.
10 Financial KPIs for Hotel Owners

This section outlines ten critical financial KPIs that every hotel owner and general manager should monitor to ensure sustainable growth and operational efficiency. These metrics cover different facets of hotel performance, from revenue generation to hotel cost control, and each one tells a different part of the hotel profitability story.
Whether you are a hotelier, a certified public accountant, or a revenue management professional, these hotel KPIs provide a comprehensive view of hotel profitability metrics and hotel performance metrics.
Financial indicators are especially important in hospitality because hotel operations carry high fixed costs and demand shifts with seasons, events, and market conditions.
Tracking the right numbers helps hotel owners, hotel management, and marketing directors spot problems early and confirm what is actually working. Key metrics such as RevPAR, ADR, occupancy rate, TRevPAR (total revenue per available room), and GOPPAR provide a foundation for hotel benchmarking and kpi analysis.
Each KPI below is explained with its definition, why it matters, and how to calculate and interpret it. Where relevant, the formulas connect to the metrics that marketing and revenue management teams already use, including RevPAR, ADR, occupancy rate, ALOS (average length of stay), and segmentation. These metrics are critical for hotel revenue management and for understanding hotel profitability.
No single metric gives a complete picture. Used together, these ten KPIs reveal how well a property fills available rooms and occupied rooms, controls operating expenses, and converts demand into profit.
They also inform decisions about loyalty programs, guest satisfaction scores (OSAT/GSS), net promoter score (NPS), and repeat booking rate, ultimately driving customer lifetime value (CLV) and positive cash flow.
Hotel SEO KPIs Benchmarks & Statistics 2024
For a deeper dive, refer to the 2026 Hospitality Benchmark Report, which provides industry benchmarks and insights from 500+ hotels. Stay up to date with the latest business trends and hotel brand interviews, and consider solutions like Revinate, Revinate Marketing, SVA Certified Public Accountants, and AI-powered ERP systems to optimize your hotel revenue management and marketing efforts.
Tools such as AI, ERP, and guest data platform can help you track hotel financial metrics, including GOP, NOI, EBITDA, and gross operating profit (GOP), as well as operational metrics like CPOR, RPS, GRI, and ARR.
Whether you are in the United States or elsewhere, these resources can help you improve direct booking percentage, reduce OTA reliance, and enhance overall hotel profitability.
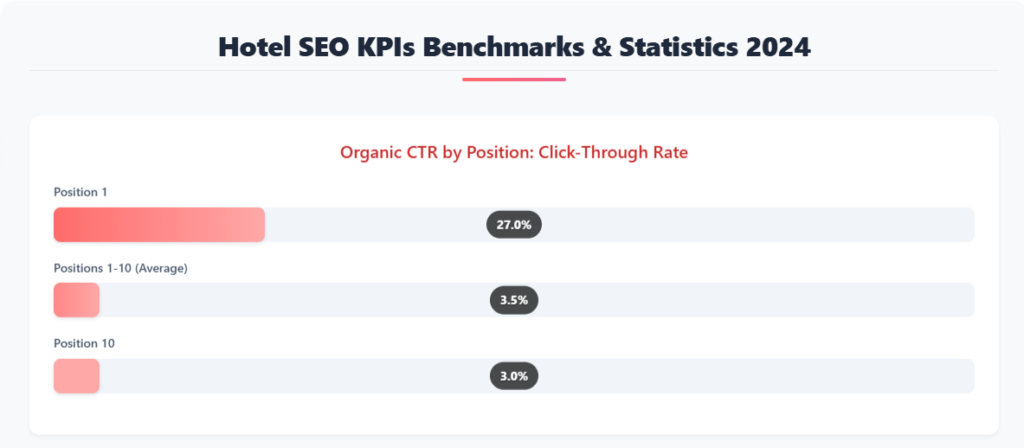
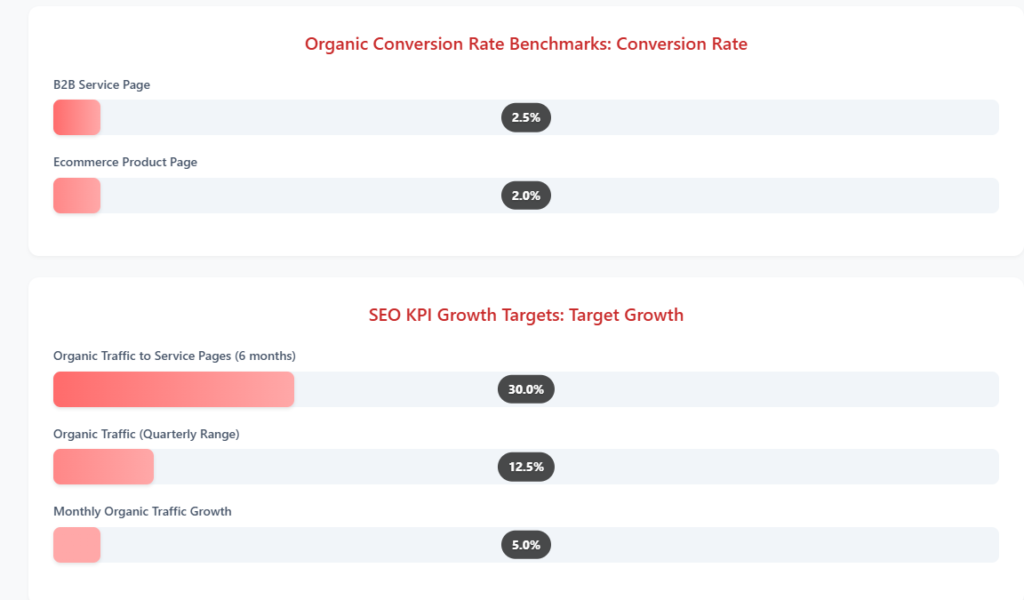
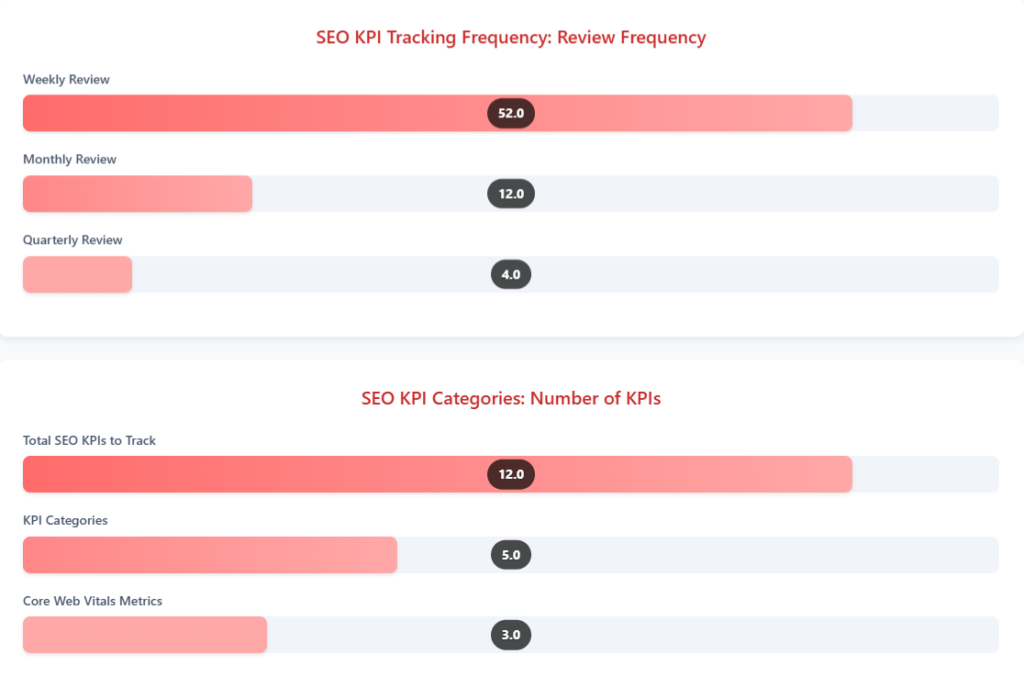
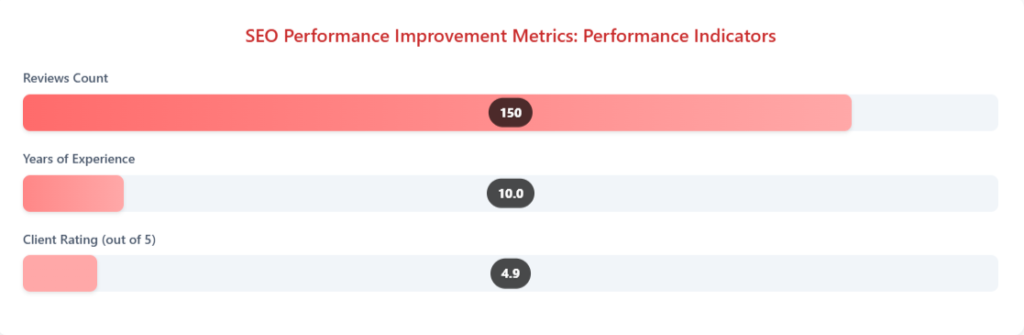
The Hotel SEO KPIs Benchmarks & Statistics 2024 a 2026 Hospitality Benchmark Report data offers a comprehensive framework for understanding how search performance translates into measurable business outcomes for hotels and hospitality businesses.
The most striking insight lies in the Organic CTR by Position figures, where Position 1 captures 27% click-through rate, compared to just 3.5% average across positions 1-10 and 3% at position 10. This dramatic decline illustrates the outsized value of ranking at the very top, meaning hotels and hospitality businesses competing for high-intent queries like “boutique hotels near me” must prioritize top-tier rankings to capture meaningful traffic.
Conversion benchmarks further contextualize this traffic value. A B2B service page converts at 2.5%, while an Ecommerce product page converts at 2%. For hotels, which often blend direct booking platform functionality with service-oriented pages, these benchmarks suggest realistic expectations for turning organic visitors into reservations, and they highlight the importance of optimizing landing pages rather than chasing traffic alone.
- Growth targets: A 30% organic traffic increase to service pages within six months, a 12.5% quarterly range, and 5% monthly growth provide tiered goals that balance ambition with realism.
- Tracking frequency: Weekly reviews (52 per year), monthly reviews (12), and quarterly reviews (4) show that consistent monitoring, rather than sporadic auditing, drives sustained performance.
- KPI structure: Tracking 12 total SEO KPIs across 5 categories, including 3 Core Web Vitals metrics, ensures technical health and visibility are measured together.
- Industry benchmarks: The 2026 Hospitality Benchmark Report from Revinate and SVA Certified Public Accountants provides United States hotel data, and Revinate Marketing supports a direct booking platform for hotel marketing to improve direct revenue and online reputation.
- Performance credibility: A 4.9 out of 5 client rating, 10 years of experience, and 150 reviews reinforce trustworthiness, supported by a customer success story and Open To Work signals on LinkedIn.
Collectively, these statistics show that hotel SEO success depends on securing top rankings, setting incremental growth targets, and reviewing performance frequently across a structured KPI framework.
1. Revenue Per Available Room (RevPAR)
RevPAR is calculated by multiplying a hotel’s average daily rate (ADR) by its occupancy rate, or by dividing total room revenue by the number of available rooms. It is one of the most widely used hospitality KPIs because it combines pricing and demand into a single number, including ADR and Occupancy Rate.
The formula is simple: RevPAR = ADR × Occupancy Rate. For example, if ADR is $150 and occupancy is 80%, RevPAR is $120. That figure reflects how well a property fills its rooms at an optimal price.
RevPAR matters for two practical reasons:
- It allows fair comparisons across properties, brands, and time periods, regardless of size.
- It shows whether revenue management decisions, such as rate adjustments or length-of-stay restrictions, are paying off.
A rising RevPAR usually signals stronger pricing power or higher demand. A falling one may point to discounting, weak direct booking percentage, or soft market conditions, and it can affect direct bookings, direct revenue, and direct booking platform performance.
One limitation is important to note. RevPAR does not account for non-room revenue such as food, beverage, spa, or events. That gap is covered by TRevPAR, or Total Revenue Per Available Room, which captures the full earning power of a property.
2. Gross Operating Profit Per Available Room (GOPPAR)
GOPPAR measures the Gross Operating Profit (GOP) generated per available room, providing insight into a hotel’s operational efficiency and profitability—an important hospitality KPI. It is calculated by dividing GOP by the number of available rooms.
GOP is total revenue minus operating expenses, excluding fixed costs like rent, taxes, and insurance. Because it factors in operating expenses, Gross Operating Profit Per Available Room (GOPPAR) is often considered a superior metric to RevPAR for assessing true hotel profitability.
Consider a simple example. If GOP is $500,000 and the property has 100 rooms, GOPPAR is $5,000. That number tells an owner how much profit each room contributes after the cost of running the hotel.
Hoteliers can improve GOPPAR in two ways: increasing revenue or controlling costs. Practical levers include:
- Refining rate and segmentation strategy to attract higher-value guests.
- Reducing cost per occupied room (CPOR) through smarter procurement and staffing.
- Growing ancillary spend on dining, parking, and experiences.
GOPPAR is especially useful for owners comparing management companies or evaluating whether a renovation or repositioning is delivering returns, alongside NOI and net operating income.
3. Earnings Before Interest, Taxes, Depreciation, and Amortization (EBITDA)
EBITDA is a widely used financial metric that measures a hotel’s operating performance by excluding the effects of financing and accounting decisions. It gives owners and investors a cleaner view of how the core business is performing.
The formula is: EBITDA = Net Income + Interest + Taxes + Depreciation + Amortization, a key measure of net operating income. By stripping out these items, it allows comparisons between hotels regardless of capital structure or accounting approach.
A high EBITDA generally indicates strong operational performance and healthy cash flow. Lenders and investors often use it to assess a property’s ability to service debt and generate returns.
Two caveats are worth remembering. EBITDA does not account for changes in working capital or capital expenditures, both of which affect real cash availability. It should always be read alongside other hospitality KPIs, not on its own.
For hotel owners, EBITDA is best used as a trend line. Watching it quarter over quarter reveals whether operational changes, marketing investments, or cost controls are moving hotel operations in the right direction.
4. Average Daily Rate (ADR)

Average Daily Rate (ADR) is the average rental income per paid occupied room, calculated by dividing total room revenue by the number of rooms sold. It is one of the most closely watched metrics in revenue management because it shows what guests are actually paying for the rooms a hotel fills.
The formula is straightforward:
ADR = Total Room Revenue / Rooms Sold
For example, if a property earns $60,000 in room revenue from 400 rooms sold, the ADR is $150. This figure reflects pricing strategy more directly than almost any other number on a hotel’s dashboard.
ADR also supports benchmarking. Hoteliers and marketing directors can compare their average daily rate against similar properties in the same market and segment. A rate that consistently trails competitors may signal weak positioning, outdated packaging, or over-reliance on discount channels.
However, ADR alone does not indicate profitability. A high ADR paired with low occupancy may not produce optimal RevPAR, because empty rooms generate no revenue regardless of the rate attached to them.
A property charging premium rates but filling only a fraction of its available rooms often underperforms a moderately priced competitor with steady demand.
Use ADR to guide pricing decisions as demand shifts. During peak seasons or local events, raising rates can capture higher value from limited inventory.
In softer periods, adjusting ADR downward or bundling value-added perks can protect occupancy without damaging long-term rate integrity.
5. Occupancy Rate
Occupancy Rate is the percentage of rooms available that are occupied over a specific period, calculated by dividing the number of rooms sold by the number of available rooms. It is a primary indicator of demand and operational performance for any hospitality business.
The formula is:
Occupancy Rate = (Rooms Sold / Available Rooms) × 100
If a hotel sells 80 rooms out of 100 available, occupancy is 80%. That percentage tells owners how well the property is converting its inventory into paying guests during a given window.
Occupancy is shaped by seasonality, pricing, and marketing reach. Strong direct bookings visibility, effective local search presence, and compelling offers all influence how many rooms get filled, while OTA mix, online reputation, and guest experience also play a role.
A drop in occupancy often points to a demand problem, a pricing mismatch, or weak visibility in the channels travelers actually use.
High occupancy does not always mean high profitability if ADR is low. Selling every room at a deeply discounted rate can cover operating expenses but leave little room for gross operating profit. Hoteliers should read occupancy alongside ADR and RevPAR to understand whether volume is translating into healthy margins.
Tracking occupancy over time helps marketing directors connect campaigns to real demand.
A lift in occupancy following a seasonal promotion, for instance, shows whether spend is reaching the right audience at the right moment, and whether CAC and CLV are improving across segmented lists and restaurants guests.
6. Total Revenue Per Available Room (TRevPAR)
Total Revenue Per Available Room (TRevPAR) measures the total revenue generated per available room, including revenue from rooms, food and beverage, and other ancillary services, plus ARR and ALOS context. It captures the full financial picture in a way that RevPAR cannot, because RevPAR only counts room revenue.
The formula is:
TRevPAR = Total Revenue / Available Rooms, with Average Length of Stay and Guest Satisfaction Score as supporting metrics.
If total revenue is $200,000 across 100 available rooms, TRevPAR is $2,000. That number reflects every dollar the property earns per room, not just what guests pay for the bed itself, and can be enhanced with AI, ERP, and guest satisfaction scores.
This metric, Total Revenue Per Available Room (TRevPAR), encourages hotel owners and marketing directors to focus on non-room revenue.
Spa treatments, restaurant covers, event space, parking, and retail all contribute to TRevPAR. A high TRevPAR typically indicates effective cross-selling and upselling throughout the guest journey.
Consider two hotels with identical Average Daily Rate (ADR) and Occupancy Rate.
The one that converts diners, spa bookings, and package add-ons will post a higher TRevPAR, and often a stronger Gross Operating Profit. That difference usually comes down to how well the property markets its full offering, not just its rooms.
For hospitality businesses investing in SEO and AI discovery, TRevPAR is a useful lens.
Content that promotes dining, experiences, and packages alongside accommodations can lift Total Revenue Per Available Room, supporting healthier cash flow and operational efficiency across the property.
7. Net Operating Income (NOI)
NOI is a key profitability metric that measures the income generated from a hotel’s operations after deducting operating expenses but before deducting financing costs and taxes. For hotel owners and investors, it is one of the clearest signals of how well the property performs at the operational level.
It also serves as a measure of EBITDA after property-level costs.
The standard formula is straightforward:
- NOI = Total Revenue – Operating Expenses
Total revenue includes room revenue, food and beverage income, and other departmental earnings. Operating expenses cover costs such as labor, utilities, marketing, maintenance, and administrative overhead.
NOI differs from EBITDA in an important way. EBITDA measures earnings before interest, taxes, depreciation, and amortization.
NOI typically sits below EBITDA because it accounts for certain property-level costs, though definitions vary by context. What matters is consistency: use the same calculation method quarter over quarter so trends stay meaningful. For instance, the 2026 Hospitality Benchmark Report from SVA Certified Public Accountants highlights industry EBITDA margins.
Investors and lenders rely on NOI to value a property. A higher NOI generally supports a higher valuation, stronger loan terms, and better cash flow.
For marketing directors, the connection to SEO is indirect but real. Better search visibility drives direct bookings, which lowers distribution costs and lifts revenue without adding proportional expenses.
Improving NOI comes down to two levers: increasing revenue and reducing operating costs. On the revenue side, hospitality businesses can grow Occupancy Rate, ADR, and RevPAR through stronger direct booking percentage and smarter revenue management.
On the cost side, tracking CPOR (cost per occupied room) helps hoteliers spot inefficiencies in guest acquisition and service delivery.
NOI also connects to other hospitality KPIs in this guide. GOP, GOPPAR, and TrevPAR all feed into the broader profitability picture, while Guest Satisfaction Scores and CAC influence how much it costs to keep rooms filled. Together, these metrics give hotel owners a complete view of operational efficiency and financial health.
8. Customer Acquisition Cost (CAC)

CAC is the average cost incurred to acquire a new guest, calculated by dividing total marketing and sales expenses by the number of new guests acquired. The formula is simple:
- CAC = Total Marketing and Sales Expenses / Number of New Guests
For example, if a hotel spends $10,000 on marketing in a month and acquires 100 new guests, the CAC is $100. That figure becomes a benchmark for evaluating whether campaigns deliver acceptable returns.
Tracking CAC matters because it directly affects hotel profitability. If the cost to acquire a guest approaches or exceeds the profit that guest generates, the property loses money on every new booking.
This problem is especially common when hotels rely heavily on OTAs, where commission fees can push effective acquisition costs well above what direct channels require.
High CAC erodes margins and reduces the funds available for guest experience improvements, property upgrades, or staff retention. Marketing directors should review CAC alongside ADR and Average Length of Stay (ALOS) to understand the true value of each acquired guest.
Several strategies help reduce CAC:
- Improving direct booking percentage through optimized website content and search visibility
- Email marketing that re-engages past guests at a fraction of paid acquisition costs
- Optimizing digital advertising by targeting high-intent search terms rather than broad audiences
- Strengthening local search presence so nearby and in-market travelers find the property first
Email-attributed revenue deserves particular attention, Revinate Marketing can help track it. Guests who book through owned channels typically cost far less to convert than those acquired through OTA platforms. When marketing directors compare CAC by channel, they can shift budget toward the sources that deliver the best balance of volume and efficiency.
CAC should also be reviewed alongside Customer Lifetime Value (CLV). A higher upfront acquisition cost can be justified if the guest returns multiple times. This aligns with insights from Harvard Business Review, which emphasizes that CLV is critical for strategic decisions.
Hotels that track repeat stay rates and email-attributed revenue gain a clearer picture of which acquisition channels actually pay off over time.
9. Guest Satisfaction Scores
Guest Satisfaction Scores quantify how well a hotel meets or exceeds guest expectations, often measured through post-stay surveys and review platforms like Revinate.
These scores influence hotel profitability through repeat business, word-of-mouth referrals, and online reviews that shape booking decisions.
Several metrics are commonly used to track satisfaction:
- Net Promoter Score (NPS): measures how likely guests are to recommend the property
- Customer Satisfaction Score (CSAT): captures satisfaction with specific touchpoints or the overall stay
- Online review ratings: aggregate scores from platforms like Google, TripAdvisor, and Booking.com
Collecting these scores requires a consistent process. Post-stay emails, in-room prompts, and follow-up surveys all work. The key is analyzing results by segment, room type, and stay purpose so hoteliers can identify patterns rather than reacting to individual complaints.
High satisfaction scores drive tangible financial benefits. Loyal guests tend to book directly, which supports a higher direct booking percentage and lowers CAC. They also accept higher ADR because they trust the experience.
Higher review scores tend to support stronger revenue, though the exact impact varies by market and property type. For example, a Guest Satisfaction Score above 4.5 in the United States often correlates with premium pricing.
Satisfaction also connects to operational efficiency. When guests report fewer issues, staff spend less time resolving complaints, which reduces CPOR and supports better GOP.
Hotels that monitor satisfaction alongside financial metrics like RevPAR and NOI gain a fuller view of what drives long-term performance.
For marketing directors, guest satisfaction is both an outcome and an input. Strong scores feed review content, improve search visibility, and reinforce the property’s reputation in local search and AI discovery.
That cycle of positive feedback supports occupancy rate, room revenue, and ultimately hotel profitability. Sharing these insights on professional networks like LinkedIn can also enhance a hotel’s brand reputation.
10. Operating Expense Ratio (OER)
The operating expense ratio (OER) measures the proportion of operating expenses to total revenue, indicating how efficiently a hotel is managing its costs. For hotel owners and marketing directors, it serves as a quick gauge of whether rising revenue is actually translating into stronger hotel profitability.
The formula is straightforward: OER = Total Operating Expenses / Total Revenue. If operating expenses are $500,000 and total revenue is $1,000,000, the OER is 50%. That means fifty cents of every dollar earned goes toward running the property.
A lower OER generally signals better cost control and higher profitability. A higher ratio does not automatically mean poor management, since luxury properties and full-service hotels carry heavier cost structures than limited-service or select-service hotels. Integration with an ERP system can help automate cost tracking and improve accuracy.
OER can be broken into two broad categories that hoteliers should track separately:
- Departmental expenses: costs tied directly to revenue centers such as rooms, food and beverage, spa, and events
- Undistributed expenses: overhead that supports the whole property, including administration, sales and marketing, utilities, and property maintenance
Separating these buckets matters because a spike in one area tells a different story than a spike in another.
Rising departmental costs in rooms may point to labor scheduling or cost per occupied room (CPOR) issues. Growing undistributed expenses often reflect broader hotel operations challenges.
Monitoring OER helps identify areas for cost reduction without compromising guest experience. Cutting housekeeping hours too aggressively, for example, may lower expenses in the short term while hurting guest satisfaction scores and repeat stays.
Benchmarks vary widely by hotel type. Limited-service and select-service properties often run leaner than full-service or resort hotels, where amenities, staffing, and facilities push the ratio higher. Urban and resort locations also tend to carry higher costs than suburban or highway properties.
For market-specific benchmarks, refer to the 2026 Hospitality Benchmark Report by SVA Certified Public Accountants.
Because OER sits alongside metrics like GOP, GOPPAR, RevPAR, and EBITDA, it should never be read in isolation. A hotel can post strong Revenue Per Available Room while quietly losing margin to bloated operating expenses.
For marketing directors, OER also frames the value of direct booking efforts. Shifting share away from third-party channels, including OTA platforms, can reduce distribution costs, which flows into the expense side of the ratio and supports healthier cash flow.
Tracking OER monthly, comparing it against prior periods, and reviewing it by department gives hotel owners a clearer picture of where money is working and where it is leaking.
That discipline supports better revenue management decisions and stronger long-term hotel profitability. For a broader industry view, the 2026 Hospitality Benchmark Report provides helpful context.
Best Practices for Monitoring KPIs
Effectively monitoring financial KPIs requires a structured approach that includes regular data collection, analysis, and action. Without a repeatable process, even the best metrics become noise that nobody acts on.
The first step is setting clear benchmarks for every metric you track. Compare your occupancy rate, ADR, and RevPAR against your own historical performance and against comparable properties in your market.
Benchmarks turn raw numbers into context. This applies to Occupancy Rate and Average Daily Rate as well.
Choose a reporting cadence that matches each metric’s volatility. This should include Average Length of Stay (ALOS) and ARR:
- Weekly: occupancy rate, rooms sold, ADR, and direct booking percentage
- Monthly: RevPAR, GOPPAR, CPOR, and email-attributed revenue, plus Revinate Marketing metrics
- Quarterly or annually: EBITDA, TRevPAR, and long-term segmentation shifts
Hotel management software, an ERP, and revenue management platforms make this practical by pulling data from your PMS, channel manager, and accounting system into one view. Manual spreadsheets invite errors and delay decisions.
For those interested in a comprehensive overview, this analysis by McKinsey covers data-driven strategies shaping the travel sector’s future.
Align every KPI with a strategic goal. If the goal is higher hotel profitability, then GOPPAR (Gross Operating Profit Per Available Room) and operating expenses deserve more attention than vanity metrics. Involve department heads in reviews so findings translate into action across hotel operations.
Finally, keep the review loop tight. Assign an owner to each metric, document what changed, and revisit whether the action worked.
This discipline separates hospitality businesses that react from those that improve. Also monitor Guest Satisfaction Score and CLV to understand long-term value.
Nicole Gralapp, CPA, CExP™, a partner at SVA Certified Public Accountants, shares her insights on best practices for monitoring hotel financial KPIs.
Her background spans hospitality accounting and consulting, giving her a practical view of how hotel owners should read their numbers.
Gralapp advises owners to prioritize a small set of metrics rather than tracking everything. GOPPAR and RevPAR sit at the top of her list because they connect revenue performance to actual profit and available rooms.
Benchmarking against industry standards matters just as much. A RevPAR figure means little in isolation, but compared to competing hotels it reveals whether your revenue management is working.
She also points to tools that make monitoring easier:
- Use a dashboard for real-time visibility into revenue and costs, including Revinate data
- Run monthly financial reviews with your leadership team
- Watch operating expenses and CPOR alongside top-line revenue
Her broader message is that hospitality KPIs should inform decisions, not just fill reports. When owners review GOPPAR, RevPAR, and cash flow together, they see how guest experience, segmentation, and cost control shape hotel profitability.
That clarity helps hoteliers act before small issues become expensive ones. Considering CAC and NOI alongside these metrics can further sharpen decisions.